Thinking a lot lately about multimodal literacies and how many times I've seen interesting people (like Edward Tufte's "Naploleon's March" featured above) combine data and narrative. The work of Tim Harrower in the '90s first brought my attention to infographics, but the form has been around a lot longer.
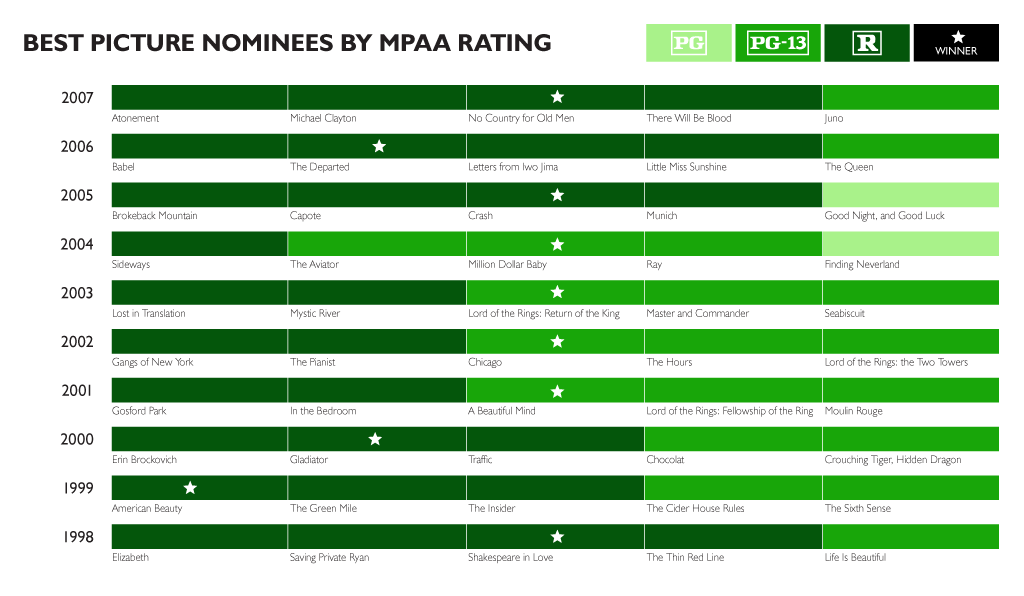
Ryan Greenberg shared his chart of Films by Ratings with me. In many ways it's easier to see the concept rather than reading it through traditional text story.
Then I came across Swivel who's mission is to "make data useful," and it helps me to see how information and images can be combined effectively. It seems like it's getting easier and more necessary to interpret information visually. And I'm thinking a lot about how I can bring this into my teaching.
No comments:
Post a Comment